Profiler
GUI component
The Tinman 3D SDK provides an API for collecting profiling samples at runtime (see IProfiler API).
The Profiler GUI component shows all registered profiling variables in a tree, along with their current value.
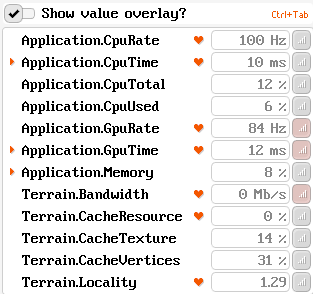
Use the Show value overlay? checkbox to enable or disable the 2D overlay that shows the current value of the profiling variables that have been tagged in the tree.
A profiling variable may have associated 'good' and 'bad' value ranges. A heart icon resp. alarm icon is displayed whenever the current value is in the 'good' resp. 'bad' range.
Each profiler variable entry in the tree has a push-button that can be used to tag it for display in the 2D overlay.