Canvas 2D
GUI Widget
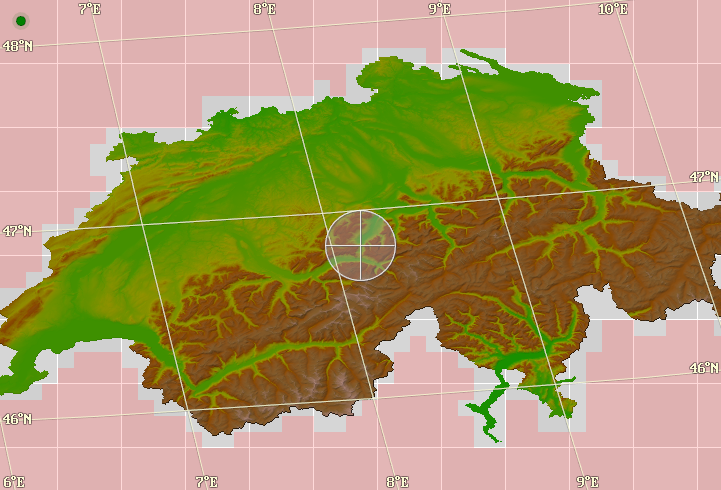
The Canvas widget provides a two-dimensional view of the raw data that is stored in a heightmap raster or pixel pyramid.
A canvas is either rectangular or a cubemap. In the latter case, the cubemap faces are unfolded and shown as a two-dimensional map.
See the Canvas API for details.
Controls
The 2D view of the Canvas widget can be controlled with mouse and keyboard.
For keyboard key names, please refer to the KeyboardKey API.
-
Scroll
Scroll view using the mouse by pressing the left button and dragging the cursor.
Center view at mouse cursor by clicking the left button.
Rotate the center cubemap face by pressing
SpaceorNumpad5; this is only available for cubemap canvases.Scroll using the arrow keys:
ArrowLeft: left
ArrowRight: right
ArrowUp: up
ArrowDown: downScroll using the keys on the number block:
Numpad1: left / down
Numpad2: down
Numpad3: right / down
Numpad4: left
Numpad6: right
Numpad7: left / up
Numpad8: up
Numpad9: right / up -
Zoom
Use the mouse wheel to increase/decrease the zoom level.
Zoom using the following keys:
NumpadAdd,PageDown: increase zoom level
NumpadSub,PageUp: decrease zoom level
Home: minimum zoom level
End: maximum zoom level -
Pick
The map coordinates under the crosshair are used to pick a raster resp. pyramid sample.
By pressing the right mouse button and dragging the cursor, the crosshair can be moved, without scrolling. To center the view, click the left mouse button.
The Canvas widget uses standard GUI controls, see Controls for details.
Canvas
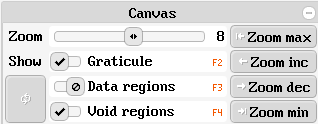
The Zoom slider can be used to set the zoom level of the canvas view.
The Zoom… buttons set the highest, next higher, next lower or lowest zoom level, respectively.
The Graticule checkbox enables or disables display of geo-referenced grid-lines.
The Data regions checkbox highlights dataset regions for which data exists.
The Void regions checkbox highlights dataset regions for which no data exists.
Map Coordinates
A Map Coordinates GUI component, attached to the current canvas.
Map Coordinates
A Heightmap Sample GUI component, attached to the current canvas.