Workshop Application
The Workshop provides users with a sandbox GUI environment for exploring the features of the Tinman 3D SDK, which offers its functionality through native C# and C++ APIs. A subset of this functionality is exposed via scripting, which the Workshop in turn exposes through an interactive user interface, in form of a simple Integrated Development Environment (IDE).
| Almost all features of the Workshop are implemented with the Tinman 3D SDK, so the same features can easily be integrated into other applications. |
Getting Started
You can start the Workshop by running its self-contained executable. Apart from copying the executable onto your machine, no other installation steps are required.
| The Workshop is a WPF application and requires the .NET Framework. |
The Workshop executable is included in the binaries folder of the Tinman 3D SDK package:
bin/net48/tinman3d_workshop.exe
bin/net8.0/tinman3d_workshop.exe
The Workshop executable may also be downloaded separately, so you do not have to download the whole package to get it.
Additional native libraries may be required by Tinman 3D SDK components or 3rd-party plug-ins. These must be present somewhere on the native library search path. If a native library is missing, the corresponding feature will not be available when running the Workshop.
| If you are unsure where to put the native libraries, just put them into the same directory as the tinman3d_workshop.exe file. |
bin/*/assimp5.x32.dll
bin/*/assimp5.x64.dll
You may register file associations for common Tinman 3D file formats, so that these files will be opened with the Workshop. Please refer to Getting Started for details.
Additional information about running the Workshop is available here:
Free Evaluation
The Evaluation licence allows to use the Workshop with a limited feature set.
When running in evaluation mode, the (evaluation) tag is visible in the title bar of the application window and a log message is output on startup:
...
2022-04-22 13:41:54 [C] c:\Users\...\tinman3d_workshop.log [Tinman.Workshop.App]
2022-04-22 13:41:56 [C] Running in evaluation mode.        [Tinman.Workshop.App]
...
The following features are not contained in the limited feature set:
- Data Export
-
Export of terrain data (i.e. geo-referenced raster or vector data, vector data, 3D geometry, 3D scenes) to non-proprietary formats (e.g. glTF, GeoTIFF).
- Plug-ins
-
Loading of custom Workshop plug-ins.
User Interface
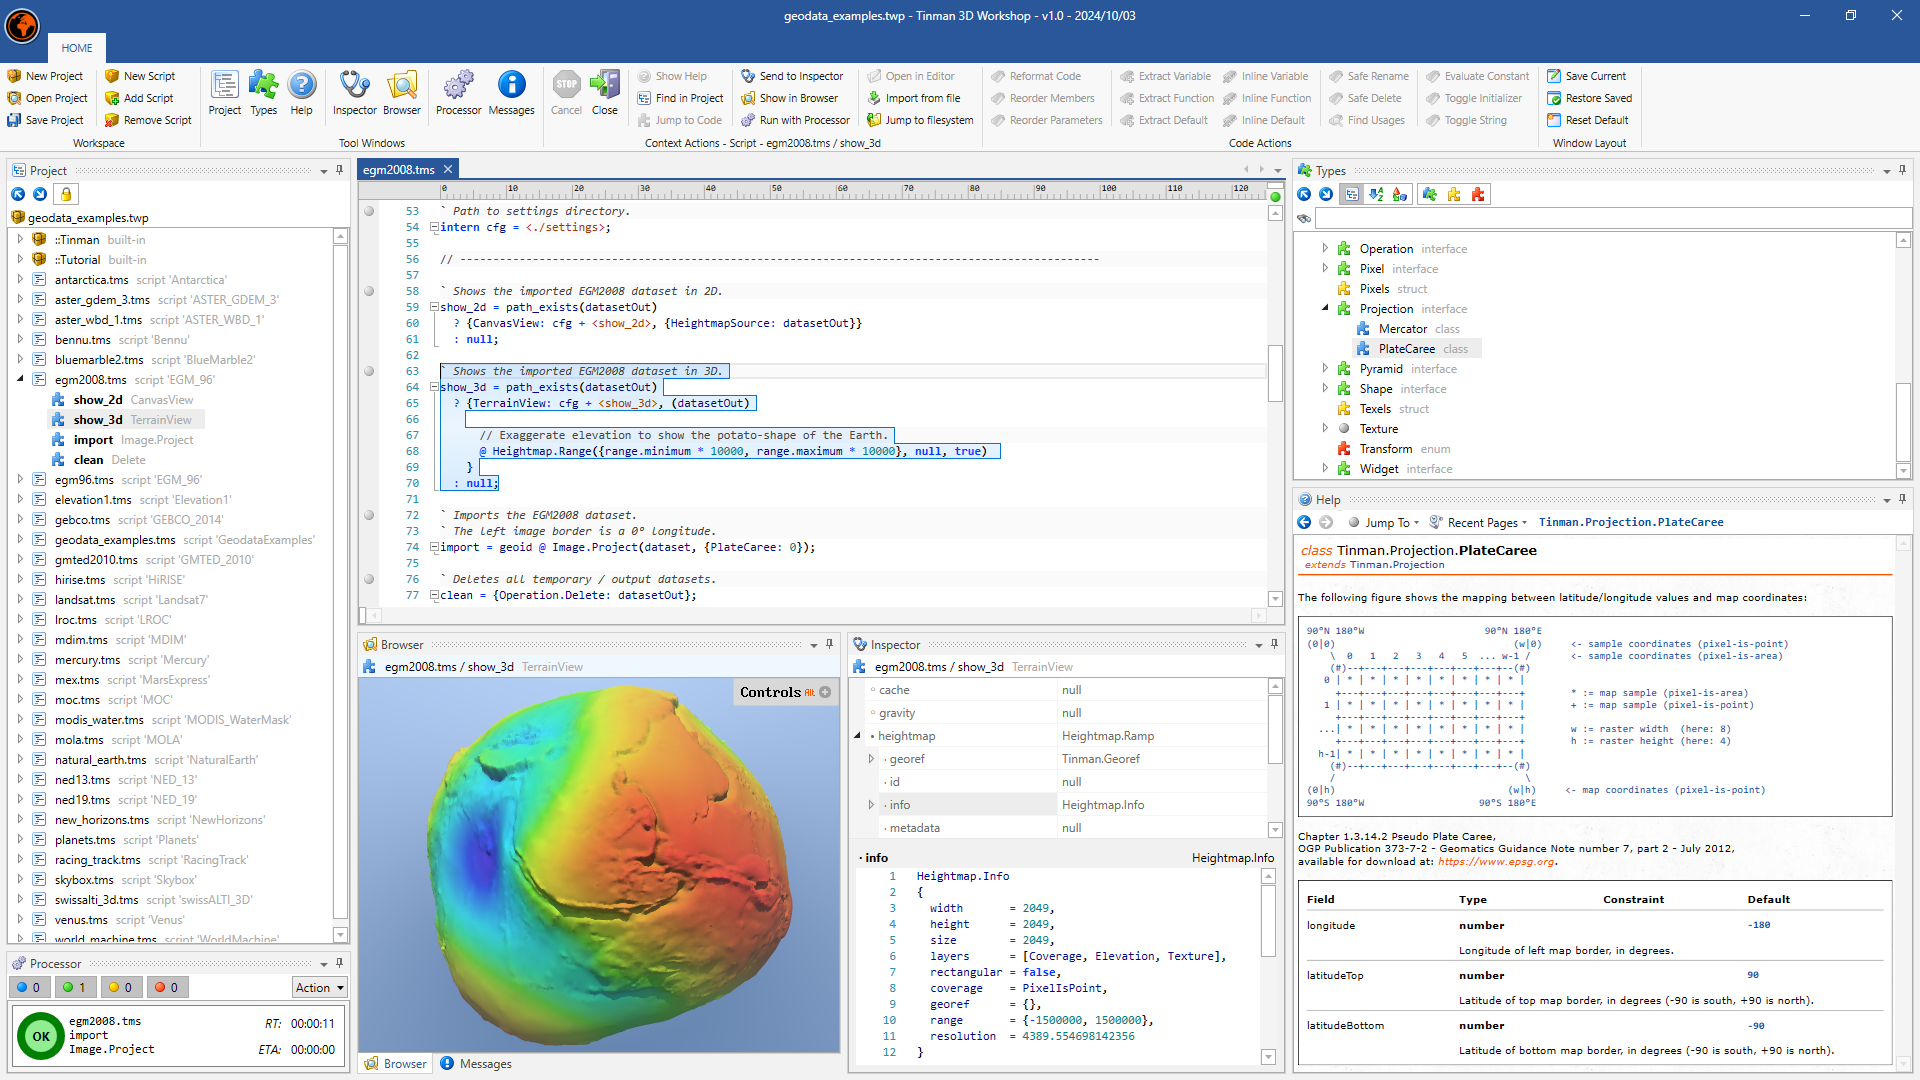
The user interface of the Workshop has a simple structure.The main window is made of a single toolbar ribbon at the top and a number of dockable tool windows below.
The tool window docking can be customized, for example by rearranging the tool windows within the main window or by distributing tool windows to separate dock container windows.
| If the window layout has become cluttered or messed up, for example after a resolution change or after changing monitors, use the command to get back to the default layout. |
The HOME section of the main toolbar is described below.

The toolbar can be accessed with keyboard chords. Press Alt or F10 to begin a chord, the available shortcut keys will appear as overlays on the toolbar.
To toggle floating toolbar mode, Left → Double-Click on the section title or use the global hotkey Ctrl+F1.
Use the global hotkey Ctrl+S to trigger the action.
Press F1 to trigger the action for the current context.
Project / Scripts |
Tools |
||
|
Application Menu |
|
Show Project Explorer |
|
New Project |
|
Show Type Explorer |
|
Open Project |
|
Show Help Browser |
|
Save All |
|
Show Inspector Tool |
|
New Script |
|
Show Browser Tool |
|
Add Script |
|
Show Processor Tool |
|
Remove Script |
|
Show Message List |
|
Cancel |
|
Close |
Context Actions Provides shortcuts to the items of the context menus of the Tool Windows. The keyboard chords Alt+X+1 … 9 correspond to the global hotkeys F1 … F9. |
|||
Code Actions Provides helpers for code refactoring and inspection for the Script Editor. |
|||
Window Layout |
|||
|
Save Window Layout |
|
Restore Window Layout |
|
Default Window Layout |
||

Tool Windows
This section describes the tool windows of the Workshop.
Project Explorer
The Project Explorer tool shows the model tree of the currently loaded project file (*.twp).
It can be activated with the Alt+X+X keyboard chord.
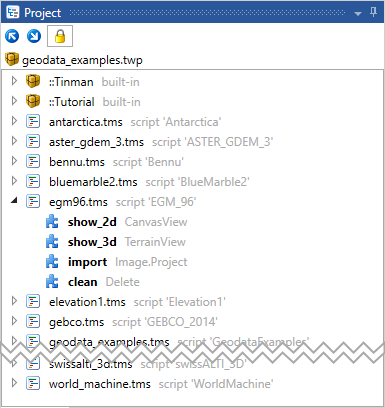
The first tree level displays the script files (*.tms) that are associated with the project.
The second tree level lists the members of each script.
There are pre-defined scripts that are included automatically in every project:
 ::Tinman
-
This is a script which provides general-purpose utility functions.
- ::Tutorial
-
This is the tutorial script, see Scripting Overview.
| Double-clicking a model tree node will trigger the action. |
The following toolbar commands are available in the tool window:
|
Collapse All |
|
Toggle Private Members |
|
Expand All |
|
Project File |
These actions are available from the (open with right-lick) of the items in the model tree:
|
Show Help |
F1 |
|
Jump to Code |
F3 |
|
Send to Inspector |
F4 |
|
Show in Browser |
F5 |
|
Run with Processor |
F6 |
|
Jump to filesystem |
F9 |
|
Close |
Script Editor
The Script Editor tool shows a source code editor tab for each open script in the project.
To open a script of the current project, double-click a script or script member node in the Project Explorer or use a action.
To close a script tab, middle-click the tab caption or use the action. Closing a tab with unsaved changes will show the Unsaved Changes dialog.
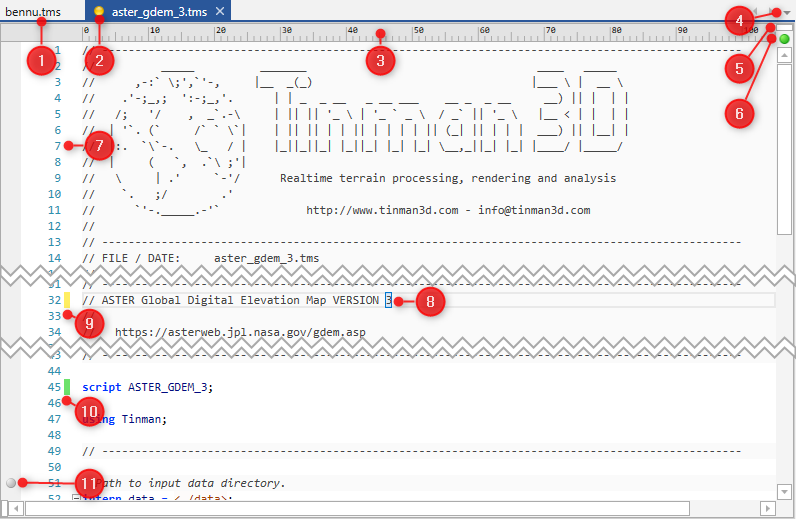
(1) Source code editor tab caption, showing the script filename
(2) Visual tag for editor tabs with unsaved changes
(3) Text column indicator
(4) Drop-down menu for selecting an open script
(5) Gizmo to drag-split the editor area
(6) Visual tag for script validation result
(7) Text row indicator
(8) Source code editor area with caret and selection
(9) Yellow indicator bar for tracking unsaved changes
(10) Green indicator bar for tracking saved changes
(11) Visual tag for script members and validation messages
Drag & drop the editor tab captions (1) to rearrange the tabs and move them between docking windows.
Drag the split gizmo (5) to split the source code editor area vertically. A second gizmo is located at the lower-left corner, drag it to split the editor area horizontally.
Click the validation result tag (6) to jump to the Message List. Hover with the mouse to display the number of validation messages in a tooltip popup.
Error and warning messages are indicated with red and yellow squiggle underlines in the editor area (8). Hover with the mouse to display the messages in a tooltip popup.
After saving a script, the yellow change markers (9) will turn green.
When closing a source code editor tab, the undo history is cleared and the green change markers (10) disappear.
Context Menus
These actions are available from the (open with right-click in the editor area), for the script member at the caret:
|
Show Help |
F1 |
|
Find in Project |
F2 |
|
Send to Inspector |
F4 |
|
Show in Browser |
F5 |
|
Run with Processor |
F6 |
|
Import from file |
F8 |
|
Jump to filesystem |
F9 |
|
Close |
These actions are available from the editor tab context menu (open with right-click on the editor tab caption):
Close |
Closes the active source code editor tab. |
Close Others |
Closes all source code editor tabs in the current group except the active one. |
Close Tab Group |
Closes all source code editor tabs in the current group. |
Close All Documents |
Closes all source code editor tabs in all groups. |
Float |
Detaches the active source code editor tab into a floating window. |
Pin |
Pins the active source code editor tab (pinned tabs appear up-front). |
New Horizontal Tab Group |
Moves the active source code editor tab to a new group. |
Move to Next Tab Group |
Moves the active source code editor tab to another group. |
Key Bindings and Mouse Gestures
The following mouse gestures are available within the source code editor area:
| Gesture | Command |
|---|---|
Left → Click |
Place caret at click location. |
Left → Double-Click |
Select the word at the click location. |
Right → Click |
Place caret at click location and open the editor context menu. |
Left → Drag |
Select text in line mode. |
Alt+Left → Drag |
Select text in block mode. |
Wheel |
Scroll up and down. |
Ctrl+Wheel |
Increase or decrease the editor font size. |
The following keys are bound to source code editor commands:
| Key | Command |
|---|---|
Clipboard / Undo |
|
Ctrl+C Ctrl+Ins |
Copy the currently selected text to the clipboard. |
Ctrl+X Shift+Del |
Cut the currently selected text to the clipboard. |
Ctrl+L |
Cut the text of the current view line to the clipboard. |
Ctrl+V Shift+Ins |
Paste the text from the clipboard into the editor. |
Ctrl+Y Ctrl+Shift+Z |
Perform a redo operation. |
Ctrl+Z |
Perform an undo operation. |
Deletion |
|
Backspace Shift+Backspace |
Delete the currently selected text or the previous character. |
Ctrl+Backspace |
Delete text to the beginning of the previous word. |
Del |
Delete the currently selected text or the next character. |
Ctrl+Shift+L |
Delete the current view line. |
Ctrl+Del |
Delete text to the beginning of the next word. |
Insertion |
|
Enter Shift+Enter |
Insert a line break at the caret position. |
Ctrl+Enter |
Insert a new line above the caret position. |
Ctrl+Shift+Enter |
Insert a new line below the caret position. |
Miscellaneous |
|
Tab |
Insert a tab at the caret. |
Shift+Tab |
Remove a tab at the caret. |
Ctrl+U |
Make the selection all lower-case. |
Ctrl+Shift+U |
Make the selection all upper-case. |
Insert |
Toggle overwrite mode. |
Ctrl+T |
Swap the characters before and after the caret. |
Ctrl+Shift+T |
Swap the words before and after the caret. |
Shift+Alt+T |
Swap the current line with the next line. |
Alt+Up |
Move the selected lines up. |
Alt+Down |
Move the selected lines down. |
Movement |
|
Down |
Move the caret one line down. |
Up |
Move the caret one line up. |
Left |
Move the caret to the previous character. |
Right |
Move the caret to the next character. |
Ctrl+Left |
Move the caret to the previous word. |
Ctrl+Right |
Move the caret to the next word. |
Home |
Move the caret to the start of the current line. |
End |
Move the caret to the end of the current line. |
Ctrl+Home |
Move the caret to the start of the script. |
Ctrl+End |
Move the caret to the end of the script. |
Page Up |
Move the caret one page up. |
Page Down |
Move the caret one page down. |
Ctrl+Page Up |
Move the caret to the topmost visible line. |
Ctrl+Page Down |
Move the caret to the bottommost visible line. |
Scroll |
|
Ctrl+Down |
Scroll down by one line. |
Ctrl+Up |
Scroll up by one line. |
Selection |
|
Ctrl+Num+ |
Expand the current selection semantically. |
Ctrl+Num- |
Shrink the current selection semantically. |
Escape |
Clear the selection. |
Shift+Down |
Move the caret one line down and expand the selection. |
Shift+Up |
Move the caret one line up and expand the selection. |
Shift+Left |
Move the caret to the previous character and expand the selection. |
Shift+Right |
Move the caret to the next character and expand the selection. |
Ctrl+Shift+Left |
Move the caret to the previous word and expand the selection. |
Ctrl+Shift+Right |
Move the caret to the next word and expand the selection. |
Shift+Home |
Move the caret to the start of the current line and expand the selection. |
Shift+End |
Move the caret to the end of the current line and expand the selection. |
Ctrl+Shift+Home |
Move the caret to the start of the script and expand the selection. |
Ctrl+Shift+End |
Move the caret to the end of the script and expand the selection. |
Shift+Page Up |
Move the caret one page up and expand the selection. |
Shift+Page Down |
Move the caret one page down and expand the selection. |
Ctrl+Shift+Page Up |
Move the caret to the topmost visible line and expand the selection. |
Ctrl+Shift+Page Down |
Move the caret to the bottommost visible line and expand the selection. |
Ctrl+A |
Expand the selection to the whole script. |
Ctrl+Shift+W |
Select the word at the caret. |
Shift+Alt+Down |
Expand the block selection downwards. |
Shift+Alt+Up |
Expand the block selection upwards. |
Shift+Alt+Left |
Expand the block selection to the left. |
Shift+Alt+Right |
Expand the block selection to the right. |
Ctrl+Shift+Alt+Left |
Expand the block selection to the previous word. |
Ctrl+Shift+Alt+Right |
Expand the block selection to the next word. |
Message List
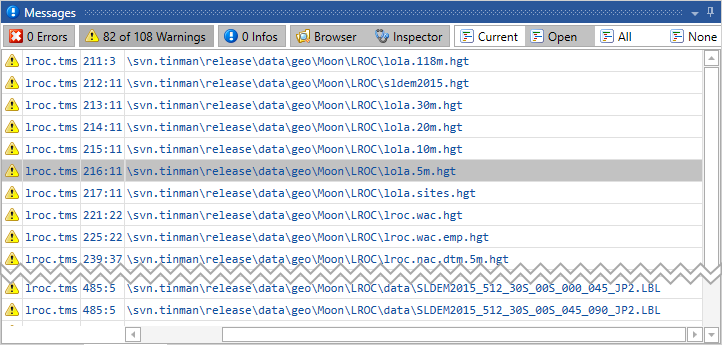
The Message List tool shows the result of the most recent validation cycle for the current project as well as the messages that have been generated by the Browser Tool and the Inspector Tool.
This tool can be activated with the Alt+X+M keyboard chord.
Validation is performed in the background while editing the scripts of the current project. The message list is updated automatically according to the results that are collected asynchronously. There is no dedicated Build or Compile action that must be performed.
| When a project is opened, an initial validation cycle is performed (which may include read-only access to the filesystem), so it is perfectly normal if messages appear right away. |
The messages are shown in a tabular list, where each row represents a single message and the columns have the following meaning:
-
The message severity (see below).
-
The message source, which will be the script filename or Browser / Inspector, if the message has been generated by the Browser Tool / Inspector Tool.
-
The source code location in row:column notation or n/a if not available.
-
The message text.
These are the message severities:
 Error
Error-
An error usually indicates a problem in the script code, for example a syntax or semantic error.
 Warning
-
A warning usually indicates a problem that will occur when inspecting, browsing or processing script members, for example non-existent files or directories.
 Info
Info-
An info is a purely supporting notice, which may be ignored without causing any problems.
| The messages in the list are sorted by severity (error first, info last), source, location (row, then column) and text. |
The following toolbar commands are available in the tool window:
|
Toggle Errors |
|
Toggle Browser |
|
Toggle Warnings |
|
Toggle Inspector |
|
Toggle infos |
|
Choose Script |
These actions are available from the (open with right-click), for the message under the cursor:
|
Jump to Code |
F3 |
| Double-click a message in the list to trigger the action. |
The buttons for filtering messages by their severity are labeled
[ ![]() n of m Errors ],
n of m Errors ],
[ ![]() n of m Warnings ],
n of m Warnings ],
[ ![]() n of m Infos ],
n of m Infos ],
where n is the number of messages that are shown in the list and m is the total number of messages in the validation result for the current project.
If n is equal to m, the buttons are labeled
[ ![]() n Errors ],
n Errors ],
[ ![]() n Warnings ],
n Warnings ],
[ ![]() n Infos ].
n Infos ].
Toggle the [ ![]() Browser ] and [
Browser ] and [ ![]() Inspector ] buttons to show or hide the messages that have been generated by the Browser Tool or the Inspector Tool.
These messages have a source value of Browser or Inspector.
Inspector ] buttons to show or hide the messages that have been generated by the Browser Tool or the Inspector Tool.
These messages have a source value of Browser or Inspector.
Click one of these buttons to choose which script messages to include:
[ ![]() Current ]
Current ]
Include only those messages that belong to the current script in the Script Editor.
[ ![]() Open ]
Open ]
Include only those messages that belong to a script that is open in the Script Editor.
[ ![]() All ]
All ]
Include all script messages in the validation result.
[ ![]() None ]
None ]
Exclude all script messages in the validation result.
Type Explorer
The Type Explorer tool shows the ConfigType instances that are available for use in the Script Editor.
This tool can be activated with the Alt+X+T keyboard chord.
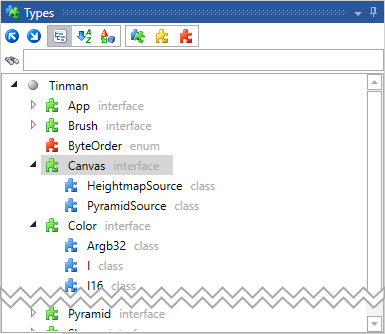
The following toolbar commands are available in the tool window:
|
Collapse All |
|
Expand All |
|
Show By Name |
|
Show Classes? |
|
Show Alphabetically |
|
Show Structs? |
|
Show By Type |
|
Show Enums? |
|
Find |
||
These actions are available from the (open with right-click), for the message under the cursor:
|
Show Help |
F1 |
| Double-click a type in the tree to trigger the action. |
Help Browser
The Help Browser tool shows the documentation of a ConfigType.
This tool can be activated with the Alt+X+H keyboard chord.
Using the action or the global F1 hotkey will show the Help Browser for the current context.
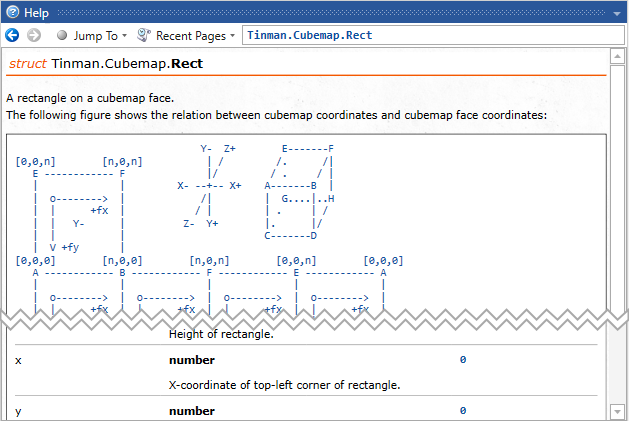
The full name of the current type is shown in the toolbar (for example: Tinman.Cubemap.Rect). Its documentation is shown in the content area of the Help Browser tool.
The following toolbar commands are available in the tool window:
|
Back |
|
Forward |
|
Jump To |
|
Recent Pages |
Inspector Tool
The Inspector tool shows the hierarchical data structure of a ConfigValue.
It can be activated with the Alt+X+I keyboard chord.
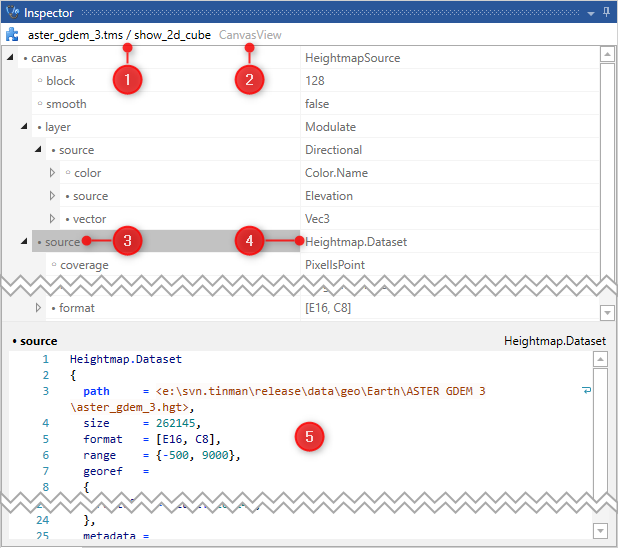
(1) The origin of the inspected value, either script / member or file path
(2) The type of the inspected value
(3) The field name of a ClassType
(4) The field value of a ClassType
(5) The script source of the selected field
To open the context menu for the inspected value, right-click on the caption bar (1). To close the inspected value, press Escape or use the context menu.
| The native object graph that has been created for the inspected value usually holds system resources, such as open files. Closing the inspected value will free those resources. |
A field name (3) may have a prefix symbol, which indicates the following:
-
Dot (
·)
The field is virtual, its value is based on a native object. -
Circle (
○)
The actual value is equal to the default field value. -
Bullet (
•)
The actual value differs from the default field value.
By clicking (3) or (4), individual fields in the hierarchy of the inspected value may be selected.
To open the context menu for the selected field, right-click on the field name (3).
The script source of the selected field is shown in (5).
| The shown script code may be copied into the Script Editor, for example to create new script members. |
This is the default logic for inspecting a given input value:
-
If value is a file path, wrap it in a Path.
-
If value is a native IConfigurable object, convert it to an Obj.
-
If value is a Path:
-
Existing file with case-insensitive suffix
.hgt?
Wrap as Heightmap.Dataset and inspect the resulting native IHeightmap object. -
Existing file with case-insensitive suffix
.pyr?
Wrap as Pyramid.Dataset and inspect the resulting native IPixelPyramid object. -
Try to wrap as a Model.Read; on success, inspect the resulting native IModelReader object.
-
Try to wrap as a Shape.File; on success, inspect the resulting native IShape object.
-
Try to wrap as a Image.File; on success, inspect the resulting native IImage object.
-
Existing file with case-insensitive suffix
.mbtiles?
Wrap as MBTiles and inspect the resulting IPixelPyramid object.
-
-
If value is a ConfigValue, inspect its hierarchical data structure.
These actions are available from the (open with right-click):
|
Show Help |
F1 |
|
Find in Project |
F2 |
|
Jump to Code |
F3 |
|
Show in Browser |
F5 |
|
Import from file |
F8 |
|
Jump to filesystem |
F9 |
|
Close |
Browser Tool
The Browser tool visualizes a ConfigValue by creating and running an embedded application for it.
It can be activated with the Alt+X+B keyboard chord.
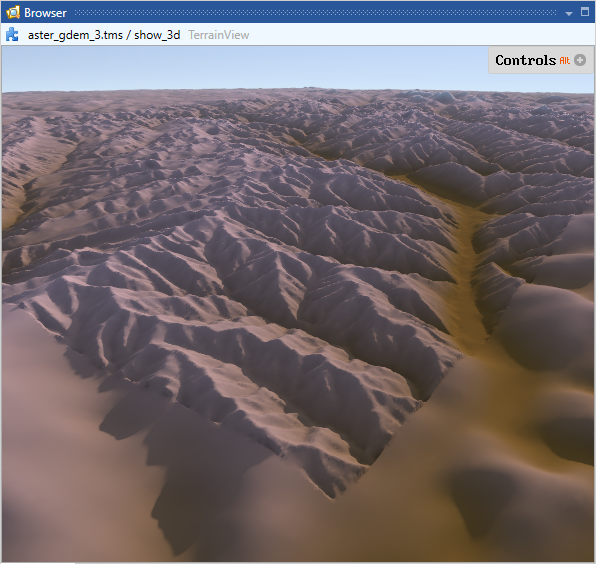
The caption bar shows the origin of the browsed value, which is either the script / member name or the file path.
To open the context menu for the browsed value, right-click on the caption bar. To close the browsed value, press Escape or use the context menu.
| The native object graph that has been created for the browsed value usually holds system resources, such as open files. Closing the browsed value will free those resources. |
The client area runs an application that wraps the browsed value.
For details on how to use the embedded applications, please refer to the content of the help browser in the Demo Application:
| Documentation | Config API | Native API |
|---|---|---|
n/a |
||
n/a |
||
n/a |
This is the default logic for browsing a given input value:
-
If value is an Image, wrap it in a Heightmap.Dataset.
-
If value is a Shape, wrap it in a Pyramid.MapShapes.
-
If value is a Heightmap or Pyramid, wrap it in a CanvasView.
-
If value is a Tinman.Widget, wrap it in an App.Widget.
-
If value if an App, run the resulting native IApplication object in the client area.
-
If value is a file path, wrap it in a Path.
-
If value is a Path:
-
Existing file with case-insensitive suffix
.hgt?
Wrap as Heightmap.Dataset and browse the resulting value. -
Existing file with case-insensitive suffix
.pyr?
Wrap as Pyramid.Dataset and browse the resulting value.. -
Try to wrap as a Model.Read; on success, browse the resulting value.
-
Try to wrap as a Shape.File; on success, browse the resulting value.
-
Try to wrap as a Image.File; on success, browse the resulting value.
-
Existing file with case-insensitive suffix
.mbtiles?
Wrap as MBTiles and browse the resulting value.
-
These actions are available from the (open with right-click):
|
Show Help |
F1 |
|
Find in Project |
F2 |
|
Jump to Code |
F3 |
|
Send to Inspector |
F4 |
|
Import from file |
F8 |
|
Jump to filesystem |
F9 |
|
Close |
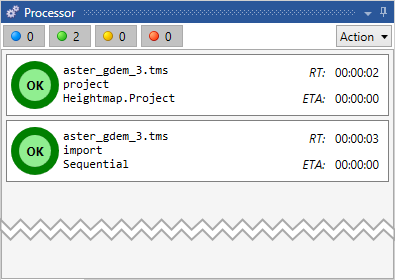
Processor Tool
The Processor Tool processes takes a ConfigValue of type Operation, creates a native operation for it and runs it in the background. A processor job item is displayed for each operation.
It can be activated with the Alt+X+R keyboard chord.
The following toolbar commands are available in the tool window:
|
Show running operations? |
|
Show finished operations? |
|
Show cancelled operations? |
|
Show failed operations? |
|
|
||
|
|
||
|
|||
Each processor job has a corresponding item in the vertical job list.
To open a popup window with additional information about a processor job, left-click its item in the job list. In the popup window, you may choose to cancel resp. close the processor job.
The circle shape on the left indicates the job status:
-
Blue
The job is running and its progress (e.g. 50%) is displayed in the shape. -
Green
The job has finished successfully and OK is displayed in the shape. -
Yellow
The job has been cancelled and ^C is displayed in the shape. -
Red
The job has failed with an error and <!> is displayed in the shape.
The lines of the center text have the following meaning:
-
Name of the script that contains the job.
-
Name of the member that represents the job.
-
The concrete Operation type of the job.
On the right, the RT and ETA values show the total running time resp. the estimated time to completion of the processor job.
These actions are available from the (open with right-click):
|
Show Help |
|
Find in Project |
|
Jump to Code |
|
Send to Inspector |
|
Cancel |
|
Close |
Dialog Windows
The following sections describe the dialog windows that are used by the Workshop.
| Dialog windows can have interactive content. In this case, clickable links are included in the content, which will trigger an action, as indicated by the link text. |
Licence Key
The licence key dialog is shown on startup when no valid licence key has been found in any of these places:
-
The licence key environment variable, unless disabled by command-line.
-
The licence key file in the application settings directory.
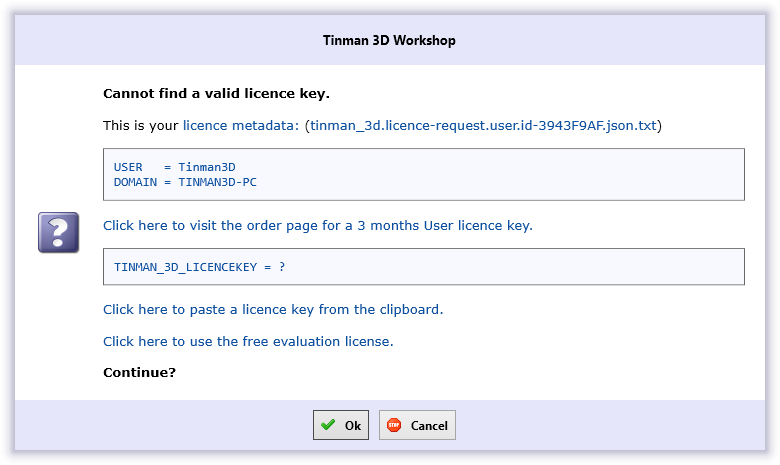
Continue with Ok to use the selected licence key or quit with Cancel.
You can click the links on the dialog content to perform various actions:
licence metadata
This will take you to the Licencing and Pricing page.
tinman_3d.licence-request.user.id-01234567.json.text
Opens the licence request file that has been generated in the current user’s home directory, for the shown USER and DOMAIN metadata.
Click here to paste a licence key from the clipboard
Selects the licence key that is currently stored in the system clipboard.
Click here to use the free evaluation license
Selects the free evaluation licence.
File Import
When importing a file into the Script Editor, the Browser or the Inspector, this dialog will be displayed.
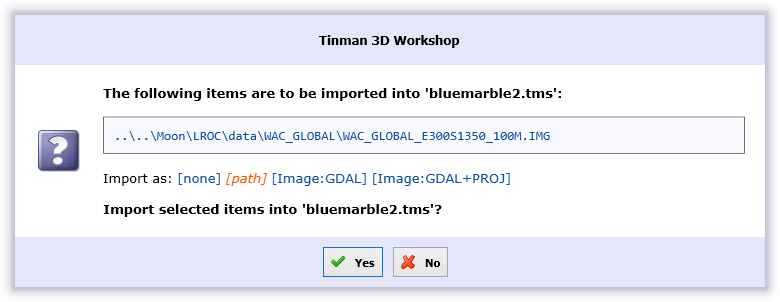
Use Yes to import the file using the selected method or No to cancel the file import.
| Additional non-default file formats for raster images, vector data and 3D models may be available. Please refer to the system information in the About Box for details. |
Use the links in the dialog content to choose how to import the file:
none
Do not import the file. This has the same effect as choosing No.
path
The file path will be imported as a path value. If possible, the path will be relative to the target script file.
Image:FORMAT
The file will be imported as an Image.File value, using the indicated format.
Shape:FORMAT
The file will be imported as a Shape.File value, using the indicated format.
Model:FORMAT
The file will be imported as a Model.Read value, using the indicated format.
Heightmap
The file will be imported as a Heightmap.Dataset value.
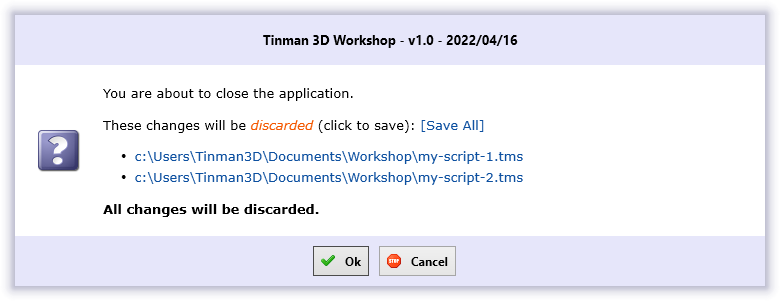
Unsaved Changes
If you close a script, project or the Workshop, you will be prompted if there are any unsaved file changes. When the dialog opens, all unsaved file changes are marked as: will be saved.
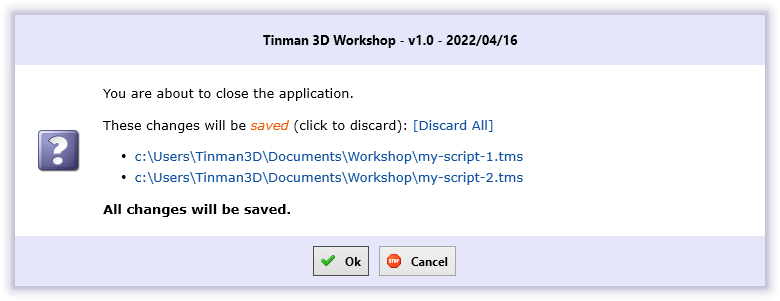
Click on Discard All to mark all unsaved file changes as: will be discarded:
Use the individual file links to toggle between will be saved and will be discarded:
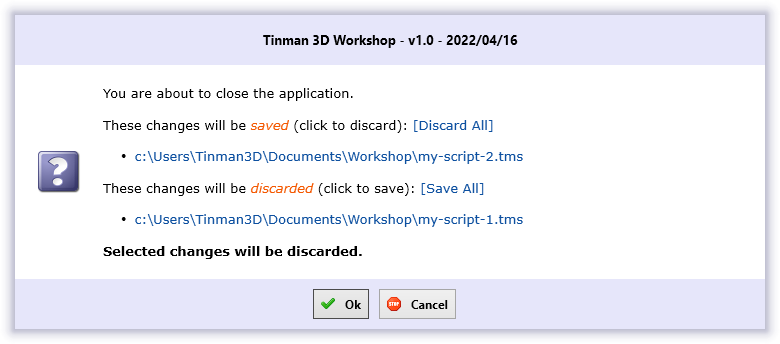
Use Ok to save / discard changes as selected and to continue with the provoking action.
Use Cancel to cancel the provoking action and retain all unsaved changes.
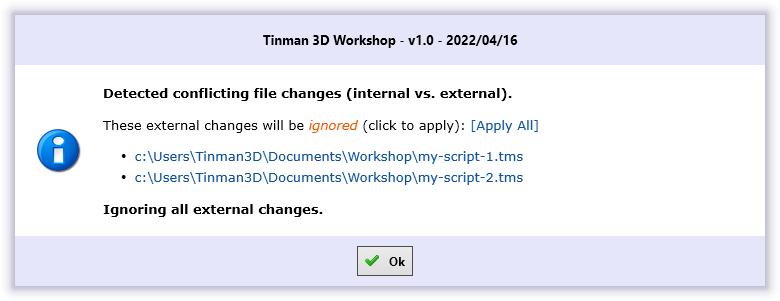
Conflicting Changes
If modifying script files both in the Workshop and in another editor, conflicting changes may occur. In this case this dialog will be displayed. When the dialog opens, all conflicting changes are marked as: will be applied.

Click on Ignore All to mark all conflicting changes as: will be ignored:
Use the individual file links to toggle between will be applied and will be ignored:
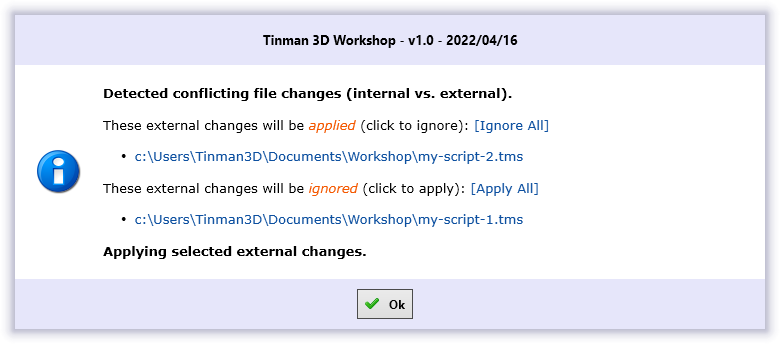
To apply an external change, the script file is reloaded, which discards the modifications in the Script Editor.
To ignore an external change, the script file is saved, which overwrites the external change with the modifications in the Script Editor.
Use Ok to apply the selected actions.
Error Report
If an unexpected error occurs, this dialog will be displayed.
A detailed error description will have been copied to the clipboard when this dialog is shown. The same information can be found in the logfile.
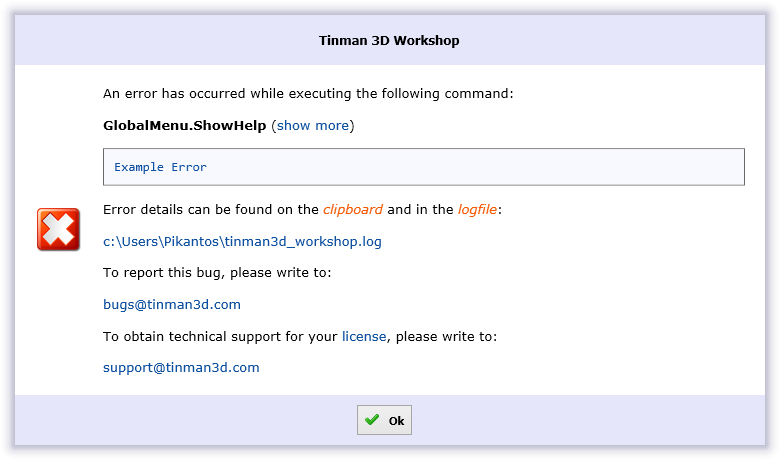
Use Ok to dismiss the error report.
You can click the links on the dialog content to perform various actions:
show more
Show additional error details.
show less
Show error message only.
license
This will take you to the Licencing and Pricing page.
About Box
The about box shows a system information report.
| The about box can be used to quickly determine where to find the application settings file and which 3rd-party libraries and plugins have been detected. |
You can reach the about box from the application menu in the main toolbar.
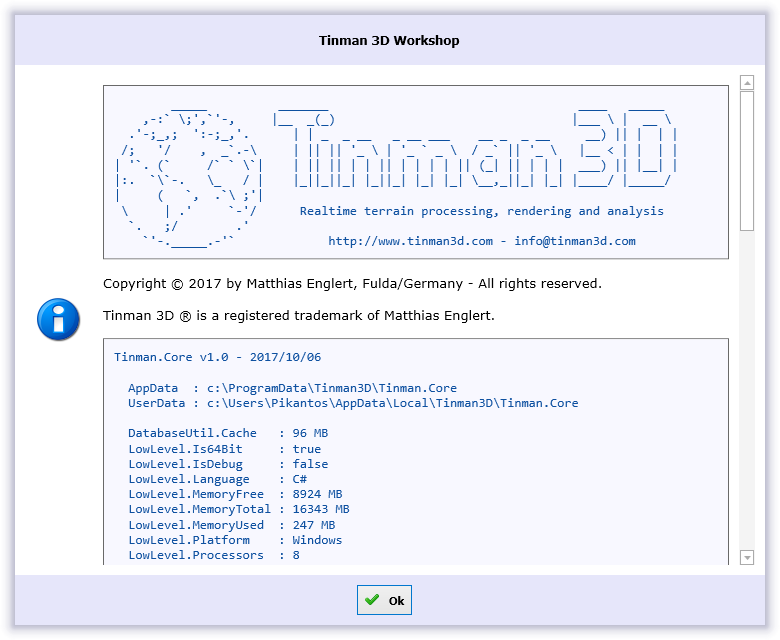
The system information report contains several items that are relevant to the Workshop:
...

Tinman.Terrain v1.0 - 2022/04/16

  ...

  ImageFormat (1)

    'Any' : Automatic image format
    'BMP' : Built-in support for BMP
    'DDS' : Built-in support for DDS
    'GIF' : Built-in support for GIF
    'JPG' : Built-in support for JPEG
    'PNG' : Built-in support for PNG
    'PXB' : Tinman 3D PiXel Buffer
    'TGA' : Built-in support for TGA
    'TIFF' : Built-in support for TIFF, GeoTIFF, BigTIFF
    'TXB' : Tinman 3D TeXel Buffer
    'GDAL' : GDAL 3.0.4, released 2020/01/28
    'GDAL+PROJ' : GDAL 3.0.4, released 2020/01/28

  ShapeFormat (2)

    'Any' : Automatic shape format
    'CSH' : Tinman 3D Compiled SHape
    'SHP' : ESRI Shapefile

...

Tinman.Engine v1.0 - 2022/04/16

  ...

  ModelFormat (3)

    'Any' : Automatic model format
    'CMH' : Tinman 3D Compiled Model Hierarchy
    'LAS' : LASer (LAS) File Format 1.3
    'OBJ' : Wavefront OBJ
    'ASSIMP5' : Open Asset Import Library 5.2

Tinman.AddOns v1.0 - 2022/04/16

  ...

  ConfigValueBrowser: (4)

    'Tinman/AddOns'
    'Tinman/AddOns/SQLite'

...

Tinman.Workshop v1.0 - 2022/04/16

  Settings : c:\Users\...\AppData\Local\...\Tinman.Workshop (5)

GeoRegistry : EPSG 9.9.1 / Tinman 1.0 (6)| 1 | The available raster image formats |
| 2 | The available vector shape formats |
| 3 | The available 3D model formats |
| 4 | The value browsers that are available to the Browser Tool |
| 5 | The path to the directory where the Workshop stores additional files. |
| 6 | The content version of the embedded geo registry. |
The Workshop stores additional files in its Settings directory:
- licence-key.txt
-
This is a text file that contains the licence key of the user. This file is written when the user provides a new key via the Licence Key dialog window.
- Settings.json
-
This is a JSON file that stores user-specific application settings.
The following settings may be edited manually:
Workshop settings file{ "CodeFontFamily": "Consolas", (1) "CodeFontSize": 14, (2) "LastProjectFilePath": "<some-path>\\geodata_examples.twp", (3) "ActiveScriptFile": "bluemarble2.tms", (4) "OpenScriptFiles": ["bluemarble2.tms", "egm2008.tms"], (5) "DockSiteLayout": "..." }1 Name of the font to use in the Script Editor 2 Size of the font in the Script Editor 3 Path to the project file that will be loaded on startup 4 Name of the project script to select in the Script Editor on startup 5 Name of the project scripts to open in the Script Editor on startup These settings will be read on startup and written on shutdown, so any manual editing should take place before the Workshop is started.
Command-line
The following tokens can be specified via the command-line (separated by whitespaces):
-
trace,debug,info
Configures logging with the specified verbosity level. -
console
Opens a console window and outputs log messages to it, in addition to writing them to the logfile. -
no-env
Disable use of the Licence key environment variable and forces the licence key file in the Workshop settings directory to be used.
Log Messages
A logfile is written to each time the Workshop runs (tinman3d_workshop.log).
The full path to the logfile is indicated in the console output:
2017-10-07 06:29:44 [C] Location of application log file:
                        c:\Users\Pikantos\tinman3d_workshop.log                                 [Tinman.Workshop.App]
Errors are indicated with [E], warnings with [W].
| During normal operation, neither errors nor warnings should occur. |
Plug-ins
When starting up, the Tinman 3D Workshop Application scans its working directory for plug-in files:
tinman3d_workshop.plugin.*.dll
tinman3d_workshop.plugin.*.exe
To be loaded successfully by the Workshop, a plug-in must meet these requirements:
-
It must be a .NET Framework 4.8 assembly or .NET Standard 2.0 assembly.
-
It must use the same Tinman assembly versions as the hosting Workshop (see About Box).
-
It must define a subclass of TinmanModule (please refer to the AddOns source code for examples).
Once loaded, a plug-in may contribute the following entities to the Workshop:
-
Additional ConfigType objects, with optional ConfigDoc
-
Additional ConfigValueBrowser objects
-
Additional raster image formats (see ImageFormat)
-
Additional vector shape formats (see ShapeFormat)
-
Additional 3D model formats (see ModelFormat)